
Debugging Kubernetes Network Traffic
Before the dawn of containerization, it was relatively easy to debug the network traffic of an application running on a regular server. One can easily run an instance of Wireshark to capture network packets or execute tcpdump utility (a command-line packet analyzer) on a server. The PCAP file generated by tcpdump can later be analyzed with Wireshark.
In today’s containerized world, capturing an application’s network traffic in a Kubernetes(k8s) environment is not an easy task as a pod may not readily accessible. Besides, a well-designed container has a minimal set of libraries and tools required to run an application. A utility such as tcpdump may not be part of a container’s toolset. This types of limitations make it difficult to analyze the traffic patterns of a kuberized application.
Setting Up A Sidecar
In k8s, a pod may contain one or more containers that are located on the same host and share a network stack. This means that containers sharing the same pod can communicate with each other on the localhost. The challenges posed by a normal k8s container can be overcome by introducing a new sidecar container. A sidecar container, which has the tcpdump utility in its toolset, can now capture the network traffic of an affected container and the k8s pod.

Figure 1. Network traffic flow in Kubernetes
As shown in Figure 1, the affected application pod will now have three containers (application container and tcpdump) including a pause container after the introduction of the new sidecar. A pause container provides a virtual network interface which lets k8s containers communicate with the outside world.
Here are the changes made to my application’s k8s deployment descriptor after adding the new tcpdump sidecar container,
apiVersion: apps/v1
kind: Deployment
metadata:
  labels:
    app: myexample-app
  name: myexample
  namespace: my-namespace
spec:
  selector:
    matchLabels:
      app: myexample-app
  replicas: 1
  template:
    metadata:
      labels:
        app: myexample-app
    spec:
      containers:
        image: myexample:1.0.0
        imagePullPolicy: Always
        name: myexample-app
        ports:
        - containerPort: 8080
          protocol: TCP
        readinessProbe:
          failureThreshold: 3
          httpGet:
            path: /health
            port: 8080
            scheme: HTTP
        resources:
          limits:
            memory: 8Gi
          requests:
            memory: 4Gi
        volumeMounts:
        - mountPath: /usr/local/myexample/config/application.yml
          name: registration-config
          readOnly: true
          subPath: application.yml
      - name: tcpdump
        image: corfr/tcpdump
        imagePullPolicy: Always
        command:
        - /bin/sleep
        - infinity
      volumes:
      - name: myexample-config
        configMap:
          name: myexample-config
Steps to Capture Network Traffic
- To view all the pods in my-namespace namespace of a k8s cluster, execute the kubectl get command.
kubectl get pods --context=my-cluster -n my-namespace
It should list all the pods,
NAME                            READY   STATUS    RESTARTS   AGE
myexample2-868c7fbd95-9ltvc     2/2     Running   0          37d
myexample2-868c7fbd95-bv8zj     2/2     Running   0          37d
myexample-65c55dcfd6-vj4db      2/2     Running   0          1h
- Run a shell in the tcpdump container of the affected application pod by executing the kubectl exec command. Make sure the pod matches the application you’re trying to debug.
kubectl exec -ti myexample-65c55dcfd6-vj4db -c tcpdump --context=my-cluster -n my-namespace /bin/sh
- Once you’re in the tcpdump shell, start capturing the network traffic by executing the following command,
tcpdump -s 0 -n -w /tmp/myexample-k8s.pcap
-
Exercise the application you’re trying to debug by calling its endpoints or other ways.
-
Once you’re finished capturing data, exit the tcpdump process by executing Ctrl+C in the shell.
-
Copy the newly created PCAP file to your local computer by executing the kubectl cp command.
kubectl cp myexample-65c55dcfd6-vj4db:tmp/myexample-k8s.pcap myexample-k8s.pcap -c tcpdump --context=my-cluster -n my-namespace
- Next, analyze the network traffic by opening the newly copied PCAP file with Wireshark.
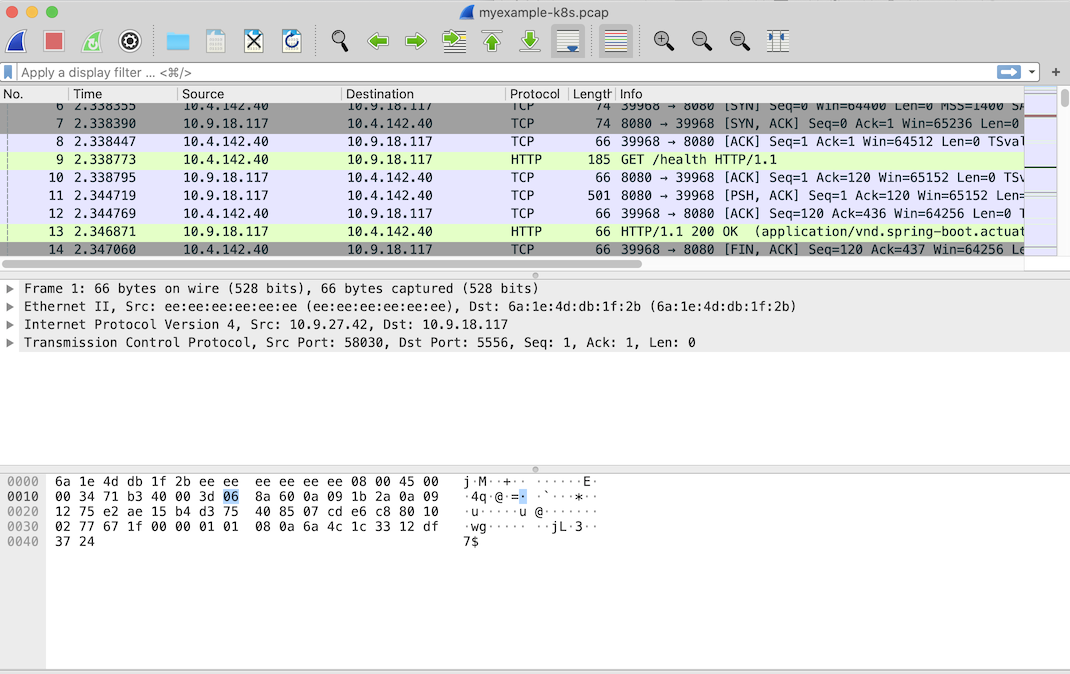
Figure 2. Viewing PCAP file in Wireshark
A sidecar container, such as tcpdump in this example, provides an alternative approach to debugging a k8s container layer. Generating a PCAP file is just the beginning. A k8s network layer is way to complicated to be solved by just one PCAP file. I’ll keep you folks posted as I begin my journey in debugging k8s network performance issue that I’m currently facing.